This subunit deals with short-run changes in both the aggregate supply and demand curves. We will have to answer the following questions for each shift:
- Which curve will this impact? AD or AS
- Which direction will the curve shift?
- What will be the result on inflation and unemployment?
Aggregate Demand Shocks
As described in 2.1 — Circular Flow Model and Gross Domestic Product (GDP) and 3.1 — Aggregate Demand, aggregate demand is shifted by , , , where:
- represents consumer spending
- represents investment and capital
- represents government intervention
- represents next exports
A positive AD shock will be anything that has a positive effect on the AD curve, resulting in a rightward shift on the AD curve. In a positive AD shock, price levels will increase, and real GDP will increase. Since real GDP represents output, we also know that employment has increased.
Conversely, a negative AD shock will have a negative effect on , , , or . In such a case, price level and output will decrease, and unemployment will also rise.
Let’s assume that consumer confidence in the economy has fallen:
- The curve impacted will be AD because aggregate demand accounts for consumer spending
- The AD will shift left as consumer confidence has reduced
- Inflation will decrease, and unemployment will increase
Aggregate Supply Shocks
As described in 3.3 — Short-Run Aggregate Supply (SRAS), the shifters of SRAS include changes to:
- Input prices
- Wages
- Inflationary Expectations
- Technology
A positive AS shock will be anything that has a positive effect on the above elements. This will result in a rightward shift of the AS curve. In a positive AS shock, price levels will decrease and real GDP will increase. Since real GDP represents output, we also know that employment has increased and inflation has decreased.
Conversely, a negative AS shock will have a negative effect on the above elements. In such a case, the price level will increase and the real GDP will decrease. Correspondingly, this means an increase in unemployment and an increase in inflation.
Let’s assume that oil production has decreased in a nation that values oil:
- The curve impacted will be AS because aggregate supply accounts for input prices and resources
- The AS will shift left as input prices have increased
- Since the price level has gone up while the real GDP has gone down, we know that inflation and unemployment have increased
Demand-Pull and Cost-Push Inflation
Demand-pull inflation is inflation that is caused due to an increase in AD, while cost-push inflation is inflation that is caused due to a decrease in SRAS.
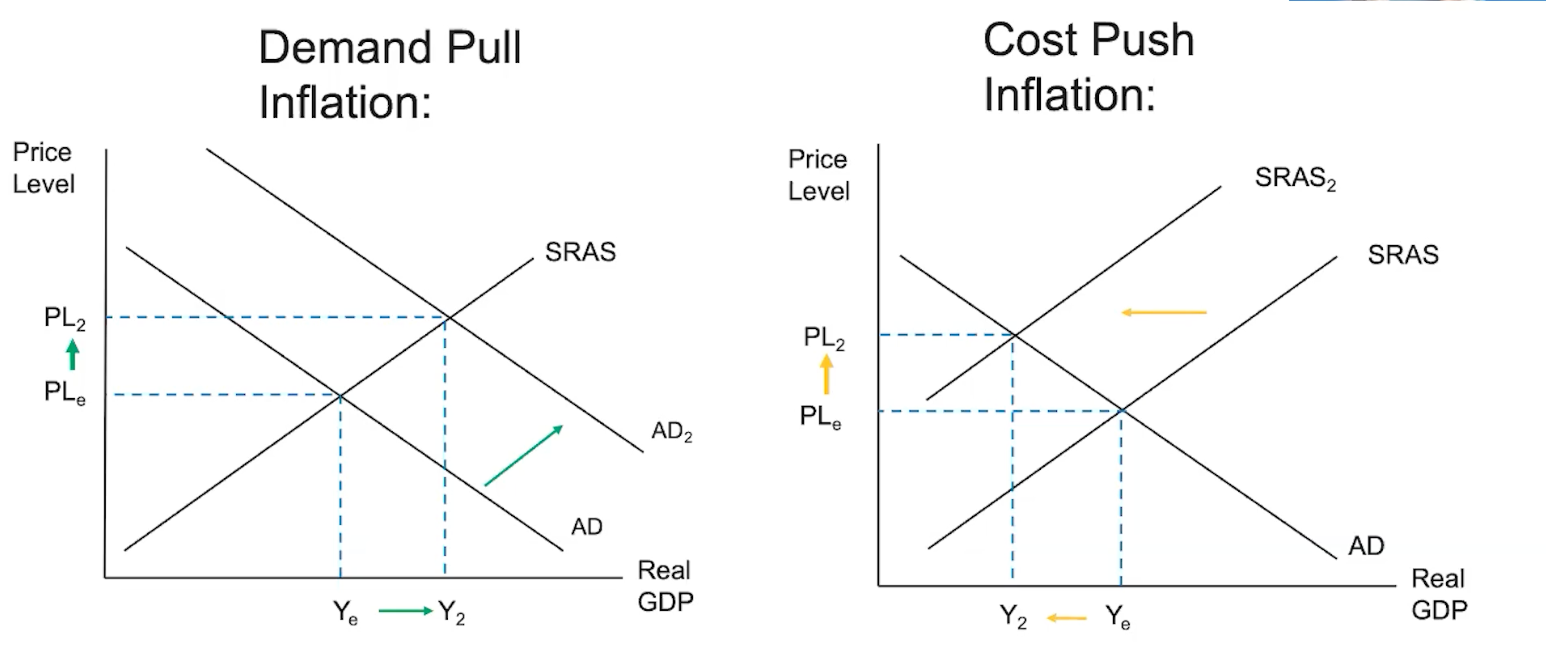
The cost-push inflation graph is also known as stagflation:
- Stagnant: output has fallen
- Inflation: prices have risen